How Long Can You Use a GPS Almanac?
Note: A longer more detailed version of this article appeared in the December 2008 issue of InsideGNSS. That article can be found here.
When you turn on your GPS receiver - what happens? Well, lots of stuff. But primarily, GPS receivers work in a two stage process:
- Look for available satellites to track
- Do everything else
In this article, I want to focus on step 1, we'll get to step 2 later. This is probably common knowledge, but for the record I want to state it. The GPS receiver uses an almanac downloaded from a single GPS satellite to help it determine what satellites are above the horizon as it searches for signals. It makes sense to not look for satellite signals that aren't even visible - it decreases your time to first fix (TTFF).
Since the receiver is simply determining whether a satellite is above the horizon, the almanacs don't have to be very accurate. They are typically a coarser version of the precise ephemeris broadcast by each individual satellite. So, given that lack of accuracy, how long you can use an almanac for analysis? Your receiver will usually download a new almanac when it sees that a new one is available, so it always has the freshest data. When you do analysis though, sometimes you may not have the latest almanac (or the one correct for the time of analysis - a related problem). So, is it ok to use any old almanac for analysis? Since they are not the most accurate ephemeris representations, should I even be using them for analysis at all? I'll answer these questions and show some interesting graphics that bring the point home.
For analysis sake, let's say we're interested in Position Dilution of Precision (PDOP) prediction. PDOP is calculated from standard formulas and requires a source of ephemeris for the satellites. You can calculate PDOP from precise, actual ephemeris, or almanac generated ephemeris. I'll compare the PDOP calculated using the almanac to 'true' PDOP - that calculated from the precise ephemeris.
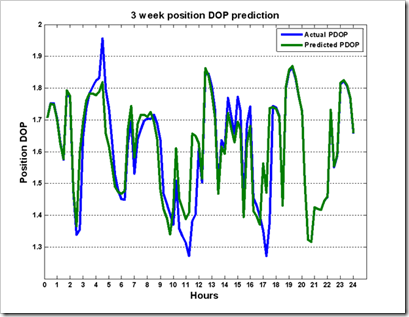
For our first analysis, let's look at 24 hours of PDOP values - using a precise ephemeris for the actual PDOP and a three week old almanac to generate the ephemeris for the predicted PDOP.
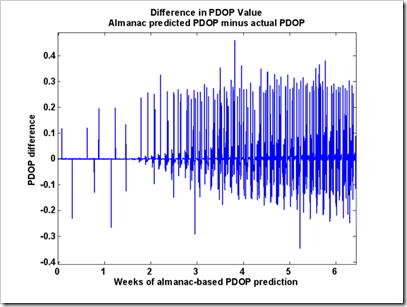
The actual PDOP is in blue, with the almanac predicted PDOP in green. We can see some differences here, though in general the predicted PDOP follows the same curves as the actual PDOP. The areas of trouble will be where the blue lines are above the green lines. In that case, the actual PDOP is greater than the predicted PDOP, and relying on your prediction can cause trouble. Let's take a look at the differences in PDOP values for a 6 week time span. I used an almanac to predict PDOP starting on the day the almanac was produced (0 days of almanac age) up to 6 weeks in the future (almanac age of 6 weeks), and differenced those predicted PDOP values against the actual PDOP values.
This graph shows something interesting. Despite an occasional spike, it looks like almanacs can be faithfully used for about two weeks to predict PDOP. The differences are essentially zero for that time span. After about two weeks, things start to go down hill. We saw hints of this in the three week old graph above. Differences in PDOP value start to increase, with the major spikes occurring more often and secondary spikes beginning to occur. Note that the negative values here are the most dangerous - when actual PDOP values are greater than predicted values. It's nice to see that the spikes appear with a greater magnitude in the positive direction than the negative.
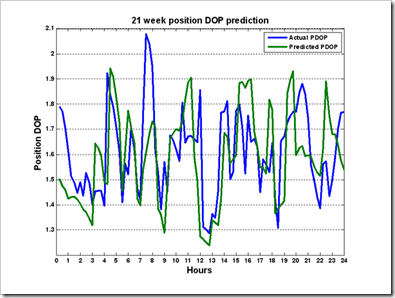
What happens if we go longer with an almanac? Here's a PDOP plot for a day, using an almanac that is 21 weeks old.
We start to see some serious problems here. The biggest problem happens around hour 8, where the actual PDOP is roughly 2.08 and the predicted is roughly 1.5. Another more stealthy error occurs at hour 20. Here, the predicted PDOP shows a drop in value, from roughly 1.93 to 1.6. These PDOP drops are associated with additional satellites coming into view and denote good times to get GPS position measurements. The actual PDOP here is rising though - indicating a failing prediction and completely incorrect information.
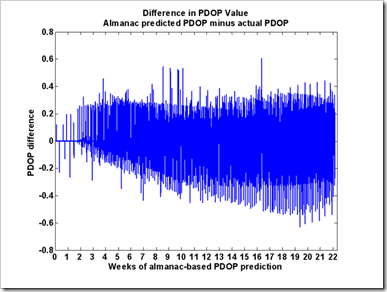
How does the difference graph look at this time span?
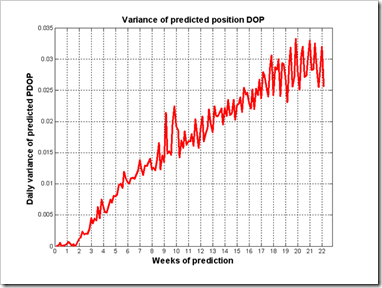
Yep - lots of problems in this regime. As the almanac ages, the negative values increase in magnitude, meaning hazardous prediction conditions. Do not use an almanac this old for operations! I want to show two more graphs that will drive this point home. The first is a PDOP difference variance graph - basically how bad the PDOP values vary from each other as a function of time.
As we saw above, the first two weeks, show essentially zero variance. After that, the variance increases linearly. This shows us again that almanacs should not be used after the two week mark. Maybe almanacs should come with an expiration date. If only you could tell they were bad by smelling them like you can with bad Nog. Oh well.
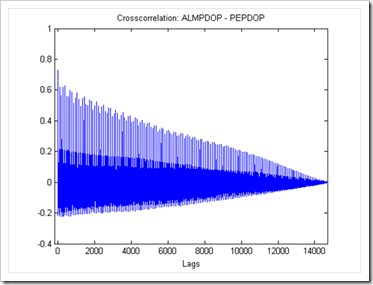
The last graph shows how well the predicted PDOP values correlate to actual PDOP values. This is a cross-correlation analysis and essentially compares the PDOP values at each point in time (in this case, every 15 minutes), and determines how well they compare to one another. A high value means they are well correlated, a low value means there is little correlation between them. There are over 14700 correlations done here; one each 15 minutes for 22 weeks. We expect the correlations to be high at the same time every day.
We see correlation spikes at the same time each day, indicating that the PDOPs do correlate then. Over time however, we see that the correlations decrease, until at 22 weeks, there is no correlation between predicted PDOPS and actual PDOPs. The first two week period is denoted by lags up to 1344. Looking at this graph, you can see that even in the first two weeks, the PDOP correlation begins to degrade. Using the most current almanac will keep you on the left side of this graph, and allow your PDOP predictions to correlate best.
To summarize, you can use almanacs to predict PDOP well for up to two weeks. Almanacs should not be used after that time period, as dangerous prediction conditions can arise. Also, to get the best performance from an almanac, use the latest one available.
So we've seen how you can use almanacs to predict PDOP, and if you've surfed around the Nog, you've probably noticed this analysis defines how well you can predict GPS accuracy as well. PDOP is a good indicator of GPS position accuracy but it's not the only player in the game. For a more in-depth analysis of predicting GPS accuracy, look at my paper on the subject here: Long term prediction of GPS accuracy - Understanding the Fundamentals.

